The Daily Tar Heel
Printing news. Raising hell. Since 1893.
Friday, Nov. 22, 2024 Newsletters Latest print issue

We keep you informed.

Help us keep going. Donate Today.
The Daily Tar Heel

Column: You should stop looking at election polls.

20201029_You_opinion-election-polling-problems-2.JPG-8.jpg

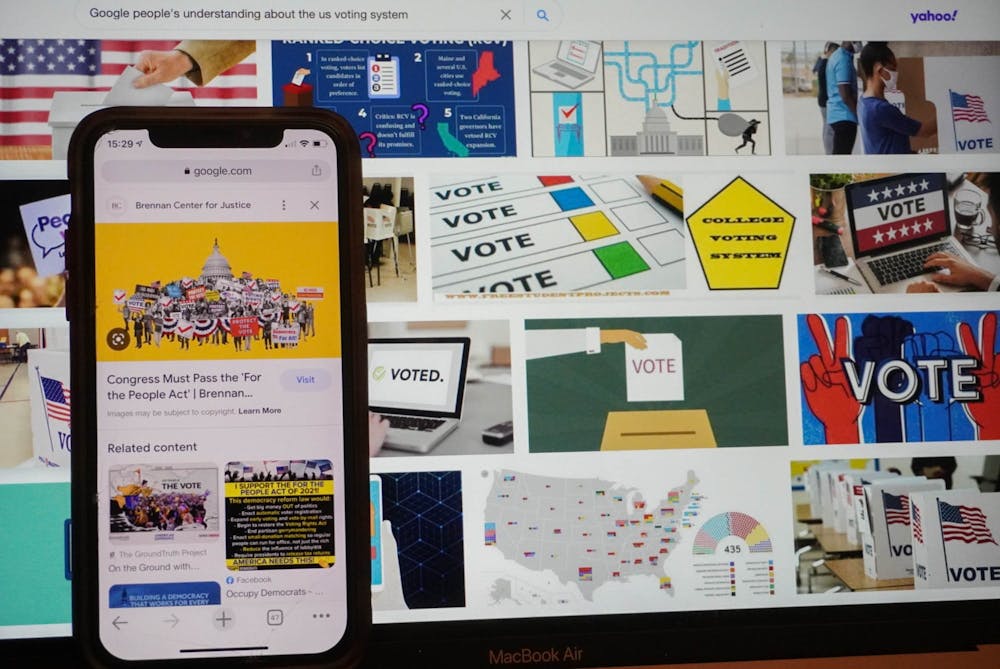
DTH Photo Illustration. Clickbait election polling is radicalized and leads to mass panic and confusion. 

This article is the journalistic equivalent of those anti-smoking ads with the old people saying “I smoked 17 packs a day and it ruined my life. Don’t smoke, kids”. I have FiveThirtyEight's polling averages pulled up right now. I am addicted. It's not healthy.

So why am I telling you to not look at election polls?

Well, there's a Mark Twain quote that goes like this: “There are three kinds of lies: lies, damned lies, and statistics." (Okay, it wasn’t actually Mark Twain – it's complicated. Google it.) 

That’s a bit of a misnomer. Numbers don’t lie, but people do. Polling is weird and if you just look at the toplines — the big numbers that tell you how much support each candidate has — you just aren’t getting the full picture. 

Polls act as a snapshot of a modeled electorate, so there are a few things you need to take into account.

Who the pollster is, how they decide likely voter screens, the partisan breakdown of the modeled electorate, sample sizes, how they conduct the polls and the questions they ask all impact the outcome of the poll.

A single poll doesn’t really tell you anything. Is a poll that shows a six-point lead for one candidate while most are showing them behind by three an inaccurate outlier or a sign of a momentum shift? Better yet, is it a sign the polls are making a systematic error in modeling the electorate?

Even aggregated polls can be drastically wrong. RealClearPolitics' polling average gave Trump a one percent lead in Ohio in the 2020 presidential election. If the polls were accurate, we’d expect that the margin of victory would be somewhere between Biden by three percent and Trump by five.

Trump won the state by just over eight percent – three percentage points over this prediction.

And sometimes the aggregators are on entirely different tracks. FiveThirtyEight and Real Clear Politics are the big players in this arena. They both use different methods. FiveThirtyEight weighs polls on a variety of factors and gradually reduces how much a poll impacts the average. RealClearPolitics just aggregates recent polling data. As of right now, no polls from before Oct. 12 are included in their average. 

So, how does this change the aggregate? Looking at the generic ballot polling — which asks voters if they would vote for a generic Democratic or generic Republican candidate and roughly shows us how the national House races will turn out — RealClearPolitics gives the GOP a 2.9-point lead, while FiveThirtyEight gives the GOP just a 0.8 percent lead. And a recent aggregate put together by Lakshya Jain at Split Ticket that uses only nonpartisan polling gives Democrats a 0.4 point lead. So who's right? Could be one of them, could be none. 

For the record, RealClearPolitics has a Republican bias and doesn’t include every available poll in their aggregation with little explanation behind their methodologies. I’d use FiveThirtyEight if you are going to obsess over an election for some reason. 

There's a chance that pollsters have underestimated the impact the Dobbs v. Jackson decision is going to have on female voters. Early voting data puts Democrats at a similar place to where they were in 2018 (you can find the data here). Polls are also showing competitive governor's races in deep blue New York and Oregon as well as ruby-red Oklahoma, and a shockingly competitive Senate race in Iowa. 

The point is, a poll can sometimes give you an idea of what a race looks like. Or maybe it won’t. No one really knows. This election is weird. Democrats should not be doing as well as it looks like they are doing. A combination of bad candidates and the overturning of Roe v. Wade is dragging the GOP down quite a bit. 

So here are some tips if you do want to look at the polls this midterm season:

  • Compare it to the averages.
  • Don’t draw conclusions from crosstabs (breakdowns of questions and answers by demographic). The sample size is almost definitely too small to mean anything.
  • Keep in mind partisan biases.
  • Look at the methodology.
  • Remember that it could just be noise.

So, when a news article pops up saying “New polls show Dems down 15 percent in California,” take it with a grain of salt.

@samadran

opinion@dailytarheel.com

To get the day's news and headlines in your inbox each morning, sign up for our email newsletters.